2003
Nighttime Lights of the World
Our
posters are space agency approved reproductions of originals. Most are
out of print or offered only as electronic downloads. They are printed
on 10 mil photographic paper and should have a long life. As with any
wall decor, keep it out of direct sunlight to avoid discoloration and
fading.
The posters have the same high quality as all of our prints but we offer them at a special reduced price for classroom use and to stimulate interest in astronomy. .
We offer our posters in four sizes.We're sure you won't find a better value anywhere else
The posters have the same high quality as all of our prints but we offer them at a special reduced price for classroom use and to stimulate interest in astronomy. .
We offer our posters in four sizes.We're sure you won't find a better value anywhere else
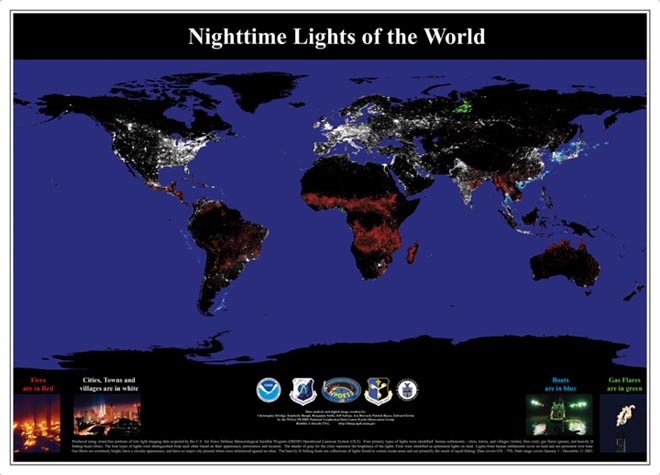
This previously released night lights poster by NOAA's National Geophysical Data Center shows lights from fires (red), city lights (white), boats & fishing activity (blue) and gas flares (yellow). Images are derived from data compiled from January 1 through December 31, 2003
Maps
have long been used to imagine events occurring on the ground from an
airborne perspective. Satellites now record a similar view of actual events
for scientists to study. The Defense Meteorological Satellite Program
(DMSP) currently operates four satellites carrying the Operational Linescan
System (OLS) in low-altitude polar orbits. Three of these satellites record
nighttime data. The DMSP-OLS has a unique capability to detect low levels
of visible-near infrared (VNIR) radiance at night. With the OLS "VIS"
band data it is possible to detect clouds illuminated by moonlight, plus
lights from cities, towns, industrial sites, gas flares, and ephemeral
events such as fires and lightning-illuminated clouds. This Nighttime
Lights of the World data set is compiled from the January - December 2003
DMSP nighttime data collected when moonlight was low. Using the OLS thermal
infrared band, areas containing clouds were removed and the remaining
area used in the time series.